Why Infographics?

- 65% of our students are visual learners
- Visual information has been proven to produce 98% better delayed recall among poor readers and 73% better delayed recall among good readers when compared to text-based information.
- Pairing short form text with symbols increases comprehension by 89%
- 90% of the information we retain is visual
- The brain registers visual information 60,000 times faster than any other form of communication.(lynda.com)
"Iris close-up" by derivative work: Laitr Keiows (talk)Iris_-_left_eye_of_a_girl.jpg: Laitr Keiows - Iris_-_left_eye_of_a_girl.jpg. Licensed under CC BY-SA 3.0 via Commons - https://commons.wikimedia.org/wiki/File:Iris_close-up.jpg#/media/File:Iris_close-up.jpg
|
To pack a big punch with few words
To engage students and encourage them to dig deeper (infographics engage more parts of the brain than text) To make complex information easier to understand To show relationships or trends To tell a story with data or information |

|
|
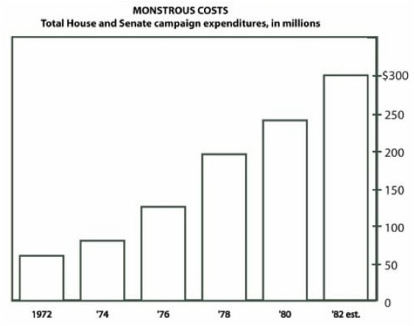
Researchers at the University of Saskatchewan used these two images to test retention. When groups were shown data in a table versus with graphic image, there was not much difference in short term recall, but in long term recall statistically significant differences in subjects' memory of data, trends and value message. Data with graphics came out on top!
In addition to their ability to help people retain what they learn, graphics are appealing!
Infographics ask for an active response from the viewer. They raise questions. "What am I seeing?" and "What does it mean?"
STANDARDS
Common Core Standards define college and career readiness, in part, as the ability to "integrate and evaluate content presented in diverse media and formats, including visually and quantitatively, as well as in words."
The MA Digital Literacy and Computer Science Standards suggest K-2 students should be able to “Individually and collaboratively create information visualizations (e.g., charts, infographics)." By high school, students should be able to “Create, evaluate, and revise data visualization for communication and knowledge."
