Subject |
Lesson Ideas |
Links |
Biography |
An infographic could introduce students to Steve Jobs or any famous person. Students could brainstorm questions about the facts in the infographic and access background information about their topic. Extension: read a biography seeking evidence to address their questions and extend their understandings. An increasing number of biography infographics feature the lives of famous people. Michael Jackson, John Williams, Gandhi are examples of individuals you can find with a Google Images search. Ask students to evaluate these infographics, then involve them in making their own biography infographic. Encourage students to begin by reading a biography that provides background information about their person of interest. The popular biography series Who Was ...? would be a great place to begin. Use Who Were the Beatles? by Geoff Edgers, along with the dozens of Beatles infographics available as examples. (Who Was is recommended for Grades 3-7) |
|
Business |
Create an infographic annual report, an infographic on how to pick a stock or track “investments," or an infographic that represents the largest bankruptcies in history by showing insolvent companies as sinking ships of relative size. |
|
English |
EXPLORE INTELLECTUAL FREEDOM Link to 12 Infographics About Banned Books Use an infographic to kick off a reading project focusing on intellectual freedom. Ask students to read one of the books from an infographic. Write or discuss why it's controversial and whether they agree with the categories identified in the infographic. PROMOTE READING and encourage youth to explore new genres Popular genres Find YA Book Infographics here A visualization, including Venn Diagrams, of time-travel plots in books, films and TV; visualization of genres, of archetypes ... . |
|
Fine Arts |
Use infographics for inspiration. Lots of infographics exist on elements of design. 10 typography infographics 10 elements of design Psychology of Color |
|
Interdisciplinary |
Current events - From bullying to drug abuse, teens face a wide range of social issues in their everyday lives. Connect infographics with popular realistic fiction as a way to discuss these issues.Ask students to create their own infographic that ties in the social issue to their realistic fiction book. This could work with wellness, English, or Social Studies. Social studies and environment - Many works of fiction and nonfiction focus on the Dustbowl era. The Great American Dust Bowl by Don Brown (Grade 5 and p) is a graphic novel focusing on this environmental disaster from American history. Karen Hesse’s Newbury winning Out of the Dust, a novel in verse, would work for 12 year olds and older students. Create an infographic resume - for self or character in a book or play Use infographics to help teach plagiarism |
Pair an infographic on the topic of Bullying with realistic young adult fiction related to bullying. Involve students in examining infographics associated with recent concerns about drought in the West, such as Drought Grips U.S. Innovation Creativity Daily Routines of Famous Creative People Infographic Resume Ultimate Guide to Notetaking Plagiarism |
Libraries: Math |
Use these for inspiration |
|
Science |
Many of the crosscutting concepts in the Frameworks and NGSS directly apply to infographics, especially "patterns," "scale, proportions, and quantities," "cause and effect," and "systems and system models." By creating infographics, students also gain experience "developing and using models," "analyzing and interpreting data," and "obtaining, evaluating, and communicating information" (NGSS Lead States, Volume 2, Appendix F, p.48). Use Citizen Scientist: Be a Part of Scientific Discovery from Your Own Backyard by Loree Griffin Burns. (Grades 3-6) Ask students to create an infographic related to a science topic of local interest, such as the migration of the Monarch butterfly. From natural disasters to human catastrophes, infographics are an effective way to visualize and analyze important world events. Pair Titanic: Voices from the Disaster by Deborah Hopkins (Grades 6 and up) with infographics showing details about the ship and disaster or Titanic 101: The Great Infographic History by Steve Hall. Try these books for inspiration: The Natural World: The World in Infographics byJon Richards and Ed Simkins. (Elementary) Planet Earth: The World in Infographics. Ages 8-up. The Super Science Infographics series from Learner Publications provides many examples. Books include Solar System, Weather and Climate, Energy and Waves, Forces and Motion, Life Science, and Natural Disasters. Grades 3-5 Animal Infographics by Chris Oxlade is one of a number of new books from Capstone's Infographics: Read Me! series focusing on infographics for younger children. Grade 2-5 Many of the books in Scholastic's Discover More Readers series contain infographics. (Volumes include: Shark Attack, Ocean and Sea, Weather, Rocks and Minerals, Rainforests, Dinosaurs, Penguins, Human Body, Bugs, Birds, Night Sky, Elements, Petting Zoo, Planets, Reptiles, Polar Animals) Grades 1-3 |
|
Social Studies |
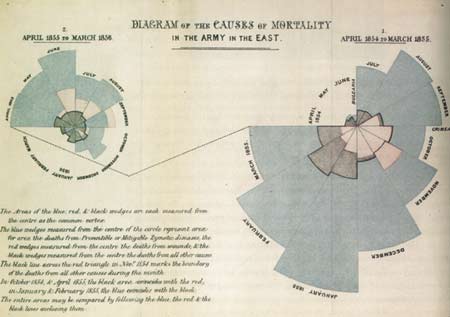
The American Civil War includes a map, dates, and information about casualties without providing information overload. It could be used by children reading Civil War on Sunday by Mary Pope Osborne. Students learning about U.S. government functions could "apply" for federal student aid or a green card or make a request permitted by the Freedom of Information Act. Analyze each process, make a pictorial representation of that process, and recommend ways it might be improved. Use infographics as part of primary-source document activities. Students reading Bomb: The Race to Build-and Steal-the World's Most Dangerous Weapon by Steve Sheinkin will find fascinating infographics that were created during the 1940s and 1950s. In January of 1951, Mutual of Omaha produced How to Survive an Atomic Bomb. Involve youth in locating other historical infographics. Florence Nightingale’s Causes of Death to British Soldiers in the Crimean War is one example. Create a map showing the percentage of family income that goes toward food (or taxes or clothing or education) in countries around the world. Try these books for inspiration: Economics through Infographics. By Karen Latchana Kenney. Illus. by Steven Stankiewicz. 2014. (Upper Elementary) U.S. Culture through Infographics (Upper elementary) U.S. Government through Infographics (Upper elementary) U.S. Geography through Infographics. By Nadia Higgins. Illus. by Laura Westlund. 2014. (Middle School) U.S. History through Infographics. By Karen Latchana Kenney. Illus. by Laura Westlund. 2014. (Middle School) World Geography through Infographics. By Karen Latchana Kenney. Illus. by Steven Stankiewicz. 2014. (Middle School) Annick Press's Native Americans: A Visual Exploration by S. N. Paleja Grades 5-8 David Macaulay’s books: The Way Things Work, How We Work, Cathedral, Castle, City, Pyramid... Many of the books in Scholastic's Discover More Readers series contain infographics. (Volumes include: Explorers, Ancient Egypt, World War II, Branches of the Military) Grades 1-3 |
|
Technology |
Use these for inspiration |
|
Wellness |
A young adult studying celiac disease might find the infographic 84 Signs You Have Celiac Disease useful in understanding the symptoms of celiac disease. Extension: Involve youth in creating an infographic that reflects their relationship with food. For inspiration, you may use the burger in Economics of America’s Favorite Food. |
|
World Languages |
Many of the books in Scholastic's Discover More Readers series contain infographics and are available in Spanish. |
-Volumes include: Sharks, Ocean and Sea, Weather, Dinosaurs, Penguins, Human Body Bugs, Birds, Elements, Planets, Polar Animals,Explorers, Ancient Egypt, World War II, Branches of the Military - Grades 1-3 World of Languages Difficulty of Learning Languages Cocoa The next three require Pinterest: Mandarin Spanish French |
