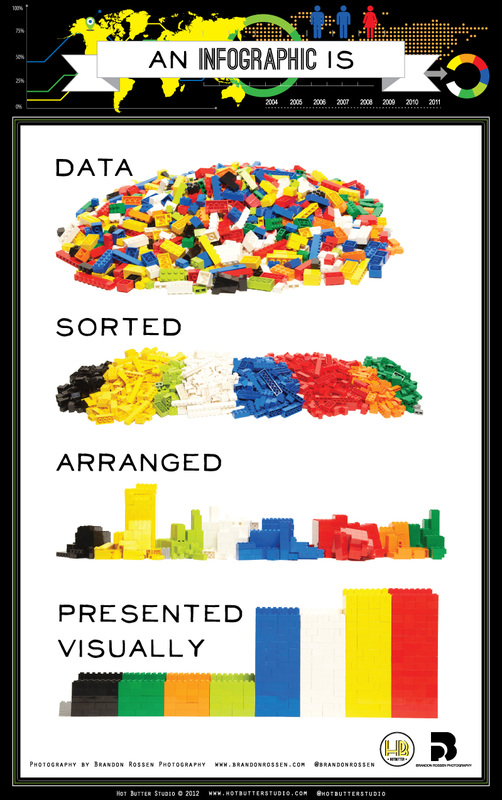
DefinitionAn infographic, information graphic, is a visual representation of information, data or knowledge which combines symbols, illustrations, and data visualizations with short texts to tell a cohesive story.
The best infographics are tidy, compact, and visually appealing. They combine elements to make data digestible and easier to retain. Today, though, a lot of designs are released as infographics when they're actually dressed-up articles where the images compliment the text and not the other way around...an infographic relies on symbols, illustrations, and clean data visualizations to tell a story. (lynda.com) Posters display images. Infographics display information. FUN FACTS: Over 10,000 infographics are published per day on the internet! There are over 88 million web page results for a search of infographics and over a million hits for infographic resumes. Humans currently create more information in two days than was created from the dawn of man through 2003. 
|
|
An effective, visual way of presenting information, infographics help readers quickly see patterns and trends, along with key information. Because of its graphic nature, infographics are appealing to the eye and a lot less dependent on text.
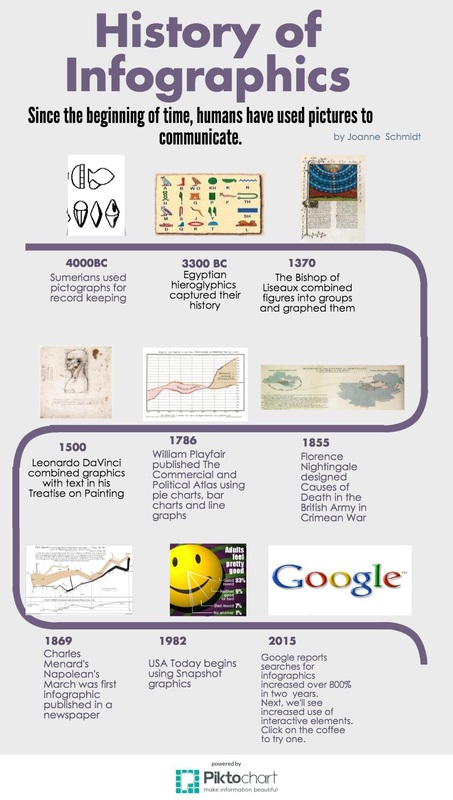
History
My Piktochart on the history of infographics.
It took about two hours even after I had assembled all the data and graphics.