Finding Elements to Use in Infographics |
Links |
Copyright free images |
|
Pixabay hosts high quality public domain images. Pixabay is an ad-supported site. When you search for images a set of sponsored Shutterstock images appears at the top of the results. The images below the Shutterstock images are free to download. |
|
Maps |
|
Sources of Data and Links |
Sources of Data and Links |
FedStats |
|
Good Luck! |
Libraries of Infographics |
Definition and Examples |
See By Subject Section Under Teaching How Tab |
|
The names say it all! |
|
Government agencies have thousands of useful infographics. Use the CDC to find science and health topics. |
|
Charts and graphs from all over the web, all beautifully designed and covering a wide variety of topics. Posts are categorized by topic and source. |
|
Check out Column Five Media’s Favorite (and not so) Cover Songs Cover Songs |
|
A blog chronicling infographics and data visualizations. Lots of topics. Posts are tagged. |
|
Interesting infographics. Lots of subjects. From cooking tips to sporting events, marketing techniques and breaking news. |
|
Infographics on education topics: e-learning, blended learning, mobile learning, instructional design, gamification, social learning, massive open online communities, and more. |
|
Topical and creative, mostly business-related graphics. Example: All Rocky Films Deconstructed |
|
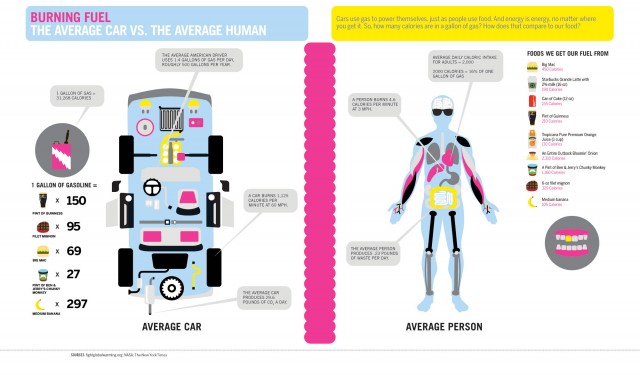
Example - Burning Fuel: Cars vs. Humans |
|
A broad spectrum of subjects: politics, sports, science, economics, and popular culture |
|
Nathan Yau plays with data and he blogs about statistics and visualization. From statistics on numbers of people by age who went to ER for punching a wall to immigration history to antibiotics versus bacteria, to a day in the life of Americans. Lots of interactive examples. Spend time getting lost in this amazing site! |
|
Topics: ridesharing, teen versus elder drivers, crowdsourcing, health, economy, smart machines, recycling and more! |
|
Collection from the British newspaper includes Dr. Who - 50 years of episodes in one data visualization is an example |
|
Over 800 well-done infographics on history topics. |
|
A commercial site that sells infographics, but you can view them on the screen. Most of their images focus on historic events. You can browse based on political, military, sports, or general graphics. |
|
Interesting and informative. Check back every week. |
|
An article with lots of examples and links |
|
really cool |
|
Updated weekly |
Libraries of Infographics (continued) |
Definition and Examples |
Browse by category: animal, business, culture, environment, food, politics, technology and more. |
|
Value |
Value |
David McCandless - distills data, information and knowledge into beautiful, interesting and useful visualizations, infographics and diagrams. Example: Extreme Global Warming Solutions |
|
Overview, Examples, Best Practices |
|
Topics include Mesopotamia, simple machines, anatomy, and more. |
|
From hammerhead sharks to plate tectonics this site has tons of great science infographics. |
|
Is weaving infographics into their publications and websites. "Change the Course" explores the importance of freshwater sources. |
|
Government websites are known for quality infographics. Search for the word infographic to find thousands of infographics across content areas. |
|
Snapshots are easy-to-read statistical graphics that present information and trends in a visually appealing way. |
|
Nearly 700 projects are categorized to make finding specific projects easier. |
|
Value |
Value |
